First I asked 2 questions.
Link to Results Spreadsheet
Then I graphed those 2 questions
Link to Scatterplot Spreadsheet
Then I graphed it on graph paper.

Then I drew the line of best fit.

I chose to points on the graph and used the slope formula to find the the slope and then I used that to find the y-intercept. That gave me the formula of the line of best fit, y=mx+b.
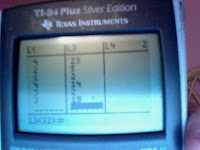
Then, i put all the points into a Graphing Calculator.
Then, I found the Calculators line of best fit.
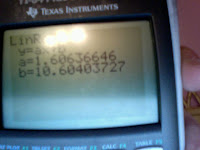
I did that by finding the calculator's version of the slope and the y=intercept.
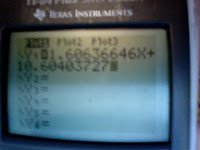
Then, I entered the exact number into the y=. If you don"t enter the exact number, the equation could be off.

Then, I finally graphed the line of fit.
I asked how many sports everyone played and what is the actual day of their birthday? There was a positive correlation between the two questions. My written equation was y=x+4 and my Graphing Calculator's equation was y=1.606646+10.60403727. The two slopes were pretty close to each other but the y-intercept was around 6 numbers apart. The question that could be answered by the equation of best fit is the relationship between the number of sports you play and your birthday.


No comments:
Post a Comment