here Link to original form.
First I asked 2 questions.
Link to Results Spreadsheet
Then I graphed those 2 questions
Link to Scatterplot Spreadsheet
Then I graphed it on graph paper.
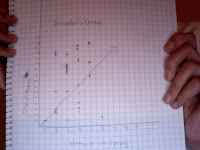
Then I drew the line of best fit.
I chose to points on the graph and used the slope formula to find the the slope and then I used that to find the y-intercept. That gave me the formula of the line of best fit, y=mx+b.
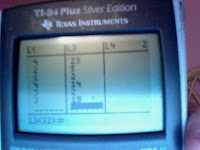
Then, i put all the points into a Graphing Calculator.
Then, I found the Calculators line of best fit.
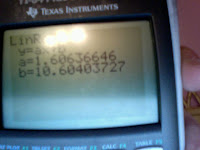
I did that by finding the calculator's version of the slope and the y=intercept.
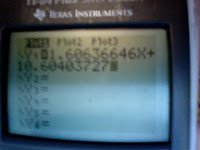
Then, I entered the exact number into the y=. If you don"t enter the exact number, the equation could be off.
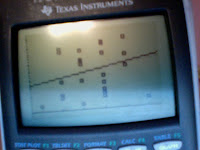
Then, I finally graphed the line of fit.
I asked how many sports everyone played and what is the actual day of their birthday? There was a positive correlation between the two questions. My written equation was y=x+4 and my Graphing Calculator's equation was y=1.606646+10.60403727. The two slopes were pretty close to each other but the y-intercept was around 6 numbers apart. The question that could be answered by the equation of best fit is the relationship between the number of sports you play and your birthday.
Wednesday, December 15, 2010
Thursday, November 11, 2010
Tuesday, September 21, 2010
Adding and subtracting Integers
Adding and Subtraction Integers
A) 5+ -8 Since it is a positive 5 and a negative 8, you subtract 5 from 8 but since the negative number is greater the the positive number, the answer is negative which is -3.
B) -4+10 Since there is a negative 4 and a positive 10 you subtract 4 from 10 but since the positive number is greater then the negative number, the answer is positive which is 6
C)4-9 Since they are both positive you just subtract 9 from 4 which gives you a negative number. The answer is negative because the greater number is being subtracted from the littler number.
D)-8-(-9) Since they are both negative numbers, you add them together getting a negative number. You add them together because when you add numbers to a negative number, it get smaller. The answer is -17.
Chapter 2 vocab
Chapter 2 Math Vocab
Absolute Value- the distance of a quantity from zero
Additive Inverse-the number in the set of real numbers that when added to a given number will yield zero.
Irrational Number-a number that cannot be exactly expressed as a ratio of two integers
Odds-the probability that something is so, will occur, or is morelikely to occur than something else
the odds of getting green is 1:6
Rational number-a number that can be expressed exactly by a ratio of two integers
Perfect square-a rational number that is equal to the square of anotherrational number
9 because 3x3=9
Wednesday, September 8, 2010
Spreadsheet graphs
It is possible to make a spreadsheet misleading. The graphs I have above are misleading because the y axis starts on 200 instead of 0.
We use spreadsheets in math to graph problems online.
Saturday, August 28, 2010
web 2.0
Web Tools:
Google Docs: We use google docs in class to write papers out of class as a class. We wrote our classroom rules as a google doc. Google docs are different from word docs because in google docs anyone with the link can add to it at the same time and it immediately shows up on anyone else's computer. That is useful because we can write those papers outside of class at the same time so it will take up less time in class.
https://docs.google.com/document/edit?id=1AXPY34OS5FhU5OzhR8eo6KeRCNRY12SkrEXe4NVTXIc&hl=en
Google Groups: We use google groups for our whole math class. Our whole math class is all in one google group. We are TESAlgebraOrange. It is useful because our teacher only has to type in the name of the group and all of our emails pop up and he doesn't have to worry if he forgot someone. In our google group we have all of our homework. So if for some reason we miss a class we can go online and get it.
Twiducate: Itis a twitter for schools. It is not public and it has to be set up a certain way to have followers. Not just anyone can follow you. I like twiducate. If you have a queston about math you can just tweet them and they can help you. I have already posted a really cool math video.
Google Docs: We use google docs in class to write papers out of class as a class. We wrote our classroom rules as a google doc. Google docs are different from word docs because in google docs anyone with the link can add to it at the same time and it immediately shows up on anyone else's computer. That is useful because we can write those papers outside of class at the same time so it will take up less time in class.
https://docs.google.com/document/edit?id=1AXPY34OS5FhU5OzhR8eo6KeRCNRY12SkrEXe4NVTXIc&hl=en
Google Groups: We use google groups for our whole math class. Our whole math class is all in one google group. We are TESAlgebraOrange. It is useful because our teacher only has to type in the name of the group and all of our emails pop up and he doesn't have to worry if he forgot someone. In our google group we have all of our homework. So if for some reason we miss a class we can go online and get it.
My groups | ||||||||||||||||||
|
Avatars: I used a site called http://www.meez.com/. I would recommend this site. It is really cool because you can choose between a million sets of clothes. They have a big selection. You can also make your avatar move if you want. This is my avatar.
Monday, August 23, 2010
Subscribe to:
Posts (Atom)