Friday, April 22, 2011

Make a million dollars

My make a million dollars spreadsheet is Here


I found that when you invest $1000 dollars at a 3% rate of change it takes 234 years.


I found that when you invest $1000 dollars at a 4% rate of change it takes 154 years.


I found that when you invest $1000 dollars at a 5% rate of change it takes 142 years.


I found that when you invest $10000 dollars at a 3% rate of change it takes 156 years.


I found that when you invest $10000 dollars at a 4% rate of change it takes 118 years.


I found that when you invest $10000 dollars at a 5% rate of change it takes 95 years.


I found that when you invest $100000 dollars at a 3% rate of change it takes 78 years.


I found that when you invest $100000 dollars at a 4% rate of change it takes 59 years.

I found that when you invest $100000 dollars at a 5% rate of change it takes 48 years.


Wednesday, April 20, 2011

my mathcasts


Sunday, April 17, 2011

Chapter 10 Vocab

Chapter 10 vocab

Real World Parabolas

The bottom of the Eiffle Tower is a parabola. the Eiffle Tower is in Paris, France. It was made of pure iron. It was built by Gustave Eiffel and it was completed in 1889. 

Wednesday, December 15, 2010

Scattered Data Post

here Link to original form.
First I asked 2 questions.
Link to Results Spreadsheet

Then I graphed those 2 questions
Link to Scatterplot Spreadsheet


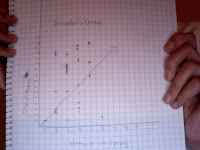
Then I graphed it on graph paper.


Then I drew the line of best fit.


I chose to points on the graph and used the slope formula to find the the slope and then I used that to find the y-intercept. That gave me the formula of the line of best fit, y=mx+b.


Then, i put all the points into a Graphing Calculator.


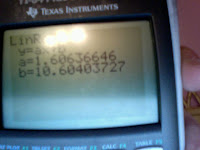
Then, I found the Calculators line of best fit.


I did that by finding the calculator's version of the slope and the y=intercept.


Then, I entered the exact number into the y=. If you don"t enter the exact number, the equation could be off.


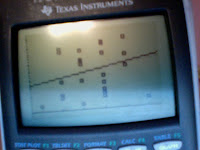
Then, I finally graphed the line of fit.


I asked how many sports everyone played and what is the actual day of their birthday? There was a positive correlation between the two questions. My written equation was y=x+4 and my Graphing Calculator's equation was y=1.606646+10.60403727. The two slopes were pretty close to each other but the y-intercept was around 6 numbers apart. The question that could be answered by the equation of best fit is the relationship between the number of sports you play and your birthday.

Tuesday, September 21, 2010

Adding and subtracting Integers

Adding and Subtraction Integers

A) 5+ -8 Since it is a positive 5 and a negative 8, you subtract 5 from 8 but since the negative number is greater the the positive number, the answer is negative which is -3.
B) -4+10 Since there is a negative 4 and a positive 10 you subtract 4 from 10 but since the positive number is greater then the negative number, the answer is positive which is 6
C)4-9 Since they are both positive you just subtract 9 from 4 which gives you a negative number. The answer is negative because the greater number is being subtracted from the littler number.
D)-8-(-9) Since they are both negative numbers, you add them together getting a negative number. You add them together because when you add numbers to a negative number, it get smaller. The answer is -17.